Where Market Valuation Is At Right Now?

In the past few years, we have probably given ourselves a little more slack because of the continuing bull run which does not seemingly going to stop. This bull run has been going for almost the past 6 years since the Great Financial Crisis and it has attracted many retail investors to start investing.


I was once a newbie investor so I totally understand how they were feeling. When market seems to be in buoyant mood and the counters you have in your watchlist are mostly green, you get a sense of security that investing is safe and profitable and you think the worst it could happen if the market undergoes some correction is to hold on to the stock and ride the storm for a couple of years. This is somewhat true in some sense. For example, buying ST Engineering at a PER of 20x means that it will take the company 20 years for them to replicate the earnings to break even at the current price you as an investor paid today. Assuming a 75% dividend payout, it will take you about 26.66 years of dividends collected to cover for the price you paid earlier. The same can be said with companies like SMRT which are trading at 30x. The logic may sound pretty decent, but I'm not too sure if we want to wait for that long to recoup our initial investment.

Company's valuation (regardless of whatever metrics you are using) remain the most solid fundamentals every investor need to consider before purchasing. I will not be talking about this for today's post. Rather, I will be presenting a very broad general market valuation of where we are at right now. Again, I want to emphasize that this is coming from a very high level point of view, so it may or may not affect your decision about today's market condition. For myself, I do not generally focus too much on these macro stories but it'll be good to understand them at the very broad level.

Here, I will be showing you the current overall market conditions based on 3 different metrics:


1.) Market Capitalization to GDP (Buffett Valuation Indicator)

If you have been reading the news regularly, this shouldn't be a stranger to you.

The market cap to GDP ratio, also dubbed the Buffett valuation indicator, is a long term ratio used to determine whether an overall market conditions is undervalued or overvalued. As the ratio suggests, a result that is greater than 100% is known to be overvalued while a value below 100% is know to be undervalued. 

If you think about it, this makes particular sense because anything above 100% means that market value has grown faster than the rise in earnings, which is a sign of overvaluation. As an investor, we certainly do not want to invest in such companies using the same logic.

In case you are wondering where we are currently at right now, we are at the 123% at the start of the year. It's probably around the same now until the next quarterly earnings are announced. A quick look at the past history and you can see that the indicator was at the highest at 153% during the dotcom bubble and 117% during the Great Financial Crisis. This gives us some indication of where we are at right now.


2.) Q Ratio (developed by Nobel Laureate James Tobin)

I have talked about this indicator at some of my posts in the past and Jeremy Grantham mentioned this a couple of times too.

The Q Ratio is an indicator of the total market value divided by the replacement cost of the overall market. This is a little bit like measuring the Price to Book where the earlier was like the Price to Earnings. Again, anything above 100% represents overvaluation while anything below represents undervaluation.

The current market we are at right now represents a Q ratio of 1.11, which indicates overvaluation. You can see for yourself where the Q ratio is at during periods where market crashed and you probably get the idea.


3.) Regression to Trend

If you have taken a statistics class in your college or uni days, you should know what a regression slope generally does to the mean of a pattern or trend.

The regression trendline drawn through clarifies the secular pattern of a variance from the trend. Where the market is trending above the regression slope, they are known to be overvaluation while the converse is true.

The periods during the dotcom bubble sees an unprecedented 147% overshooting to the slope. The same goes during the GFC where it shoots up 130%. Today's current market conditions are not too far from the peak during the dotcom bubble, which may be something an investor would want to consider.


Final Thoughts

Back to where we first start, I mentioned about the importance of focusing on the fundamentals of the company where as an investor we try not to overpay for what it is worth for. I think that should stand solid and one that every investors need to keep a close tap on.

The overall market conditions shown above is just a general guide, but it gives you an overall indication where the horse is at right now. If we apply the same logic to what we apply to individual companies, we would certainly want to avoid investing in the current market conditions. The fear of missing out on any further gains might be a loss of opportunity cost to you, but a potential permanent loss of capital might be an even more important to note of.

If you think that you are unable to participate in the current market conditions because most of the companies you researched are overvalued, then stand by the principle and put them in your watchlist. The day will come where opportunities will present itself to you so much that you might not even have the resources to take on. However, if you insist that you are ignoring valuations and you are investing for the sake of long term, then let me remind you that you might face a permanent loss of capital should things does not work out well for you. Even if it does, it might take a lot of granny years for you to recoup your losses, less alone make profits from it.

Revisit your principles in investing, focus on the fundamentals of the company and stay alert on what is going on the macro-economic news. You'll do fine just like that.


What do you think? Does the above makes any sense to you or do you have different thoughts?


Launching & Introducing - 24Fabulous

One of my goals for 2015 was to launch a mystery project to be completed by this year. Back then, I was not sure if this was going to be successfully launched and implemented by this year as I was busy completing my MBA program. There were also simply too many unknown factors and draggy questions to consider which takes plenty of time and resources. Though, I am glad that we went ahead with the project and decided to launch it successfully yesterday. 

Introducing 24Fabulous – Your one-stop online fashion destination catered to women’s apparels for fast fashion.


First off, a little bit of the background on why we decided to name it as 24Fabulous. We all know that all women love to dress up and make themselves look pretty, either for a casual or special occasion. The idea of 24Fabulous is to address the needs of women who wants to look fabulous 24/7 considering the price that one has to pay for that value she is looking for. Similar to a value investing concept, we focus on creating value rather than paying a premium price for a lower value.

The co-founder for the business was mainly administered by my wife and her sister who went ahead with the launching for both Singapore and Indonesia. Being here, my wife will handle the Singapore accounts while her sister will handle the Indonesia accounts. As providers for seed capital funding and a person numbers, her brother in law and I will be mainly handling the finances and working capital for the business. 

I have come across and analysed hundreds of companies in my investing journey, but setting up one on your own from the scratch is a totally different story altogether. Many times what we see from the customers or investors point of view is the end product but what goes through the initialization, production and stabilization are the hardest to handle. Through this experience, we have learnt many new skills and knowledge that has never been exposed to us in our normal daily lives. I did come across many of the concepts during my time studying the MBA but doing it altogether is an entirely new and exciting experience, which will increase our awareness as we move forward. For example, working with designers and suppliers or contemplating the pricing and profit sharing agreement are all practical concepts that has to be dealt with in the preparation mode. 

Some of you might know that my wife has resigned from her corporate role to become a stay home mummy. With the new business, I think she'll get her hands on both the business and taking care of our little one. I think it'll benefit everyone in the process so I am happy to see that being pushed through.

So that's it, thanks everyone for the support and don't forget to recommend it to your friend.

:) Much Appreciated :)

Facebook: https://www.facebook.com/24fabulous
Instagram: 24fabulous
Line: 24fabulous
Whatsapp: +6593874016 (Singapore) / +6281294117902 (Indonesia)
Email: shop24fabulous@gmail.com


Recent Action - Building Up Some Cash Position

In the recent years since I started investing, I have managed to gain quite a fair bit on the return of my equity portfolio from the assistance of a running bull market. 

Even though this was partially achieved through hundreds of hours of thorough monitoring and research into companies which I think are worth investing, the last thing I wanted to see is to think my strategies are formidable and can outlast any market correction or recession. Not true. 


A complete investor is one who is not only able to research on undervalued companies through analysing the different gargantuan metrics in the financial statements but who is also able to handle proper asset allocation as and when is required. In such cases, shifting towards the different percentage asset allocation at different times will serve to adapt the changing needs of the environment. 

Patience will become a very important attributes of a successful investor because for most of the times it makes one look like a fool being in cash position yielding return that loses out to inflation over time. On the other hand, an investor can look to building a cash position as an option that they can use to take advantage of the market during a market correction. Cash by itself is a position and it can become a trumpet card used to an investor advantage when the right moment comes along. 

One of my goals for this year is to build up sufficient cash position given that market valuations are stretched and finding an undervalued company to invest becomes increasingly difficult. I will talk more about the general market valuation conditions in my next post which can give us an overall indication of where the market is at right now. Even though I do not generally like to focus too much on the general macro-economic situations around the world, it is difficult to ignore the correlation because finding undervalued companies to invest are becoming increasingly difficult these days which signifies some sort of market conditions that are overvalued to a certain sense. 

Following my previous portfolio updates for the month of February, I have now divested all my holdings in MGCCT and Neratel at a market price of $1.03 and $0.76 respectively, representing an overall gains (including dividends received) of 42% and 130%. 

Divested MGCCT @ $1.03


Divested Nera @ $0.76

This is a very difficult decision to make because these are companies that has been with me for many years and has the potential to do well in the future. Having said that, I re-evaluate the current position that they are in together with the prevailing valuations and thought that they are somewhat overvalued, if not fairly valued at the least. I also asked myself at this time whether I would be willing to invest in the companies at the current price had I not been vested and the answer is a clear conviction no. Thus, my decision to divest was based on such convictions. 

As the markets are getting more expensive over time, I will be evaluating the companies in my portfolio even more on a regular basis. Even though the objective is to focus on fundamentals for the long term, it would be pretty foolish not to consider selling at some point should the market over react by providing opportunities for investors to take profits. It is not a question of whether we will see a market correction at some point in time, but a matter of when. Why not consider selling at the same conviction of when you are buying?

What about you? How are you playing the current market conditions?


"Feb 15" - SG Transactions & Portfolio Update"

 No.
 Counters
No. of Shares
Market Price (SGD)
Total Value (SGD) based on market price
Allocation %
1.
China Merchant Pacific
69,000
1.06
73,140.00
25.0%
2.
FraserCenter Point Trust
30,000
2.03
60,900.00
21.0%
3.
SembCorp Industries
10,000
4.26
42,600.00
15.0%
4.
Vicom
6,000
6.58
39,480.00
14.0%
5.
Mapletree Greater China Commercial Trust
20,000
1.03
20,600.00
7.0%
6.
FraserCommercial Trust
11,000
1.49
16,390.00
6.0%
7.
Neratel
20,000
0.77
15,400.00
5.0%
8.
ST Engineering
4,000
3.55
14,200.00
5.0%
9.
Stamford Land
10,000
0.56
  5,600.00
2.0%
10.
King Wan
5,000
0.31
  1,550.00
1.0%

Total SGD


289,860.00
 100.00%

It has been a relatively busy months of activities since my last Jan portfolio update which you can view here. First, I sold off my shares in OUE Ltd (Link here). A few days later, I also divested my shares in Ascott which I have been holding for years. You can view the post here if you are interested.

I reallocated some of the proceeds into accumulating some of the shares in China Merchant Pacific and Sembcorp Industries. You can refer to my Recent Transactions update should you wish to know more regarding the detail. I also blogged a few times this month into Sembcorp Industries which you can find in my previous posts.

Overall, the earnings and reporting season for the companies in my portfolio I am currently holding have been satisfactory, which leads to the run up in its price. I am still awaiting for the full year announcement for China Merchant Pacific and Neratel and expect both of them not to disappoint. Finger cross on this.

The overall portfolio has increased from the previous month of $282,570 to $289,860 this month. This was due to the recent run-up in a few of the holdings which brings the total market value upwards by quite a bit this month. The estimated annual dividends from the portfolio is $15,148, which is yielding at 5.22%.


I know that we are only in the second month of the year but I am certain enough that I am going to fail this year portfolio objective by quite a bit. As some of you might already know, I am trying to build up quite a substantial bit of cash position which I have done so in Jan and Feb this year. As we are approaching a further run-up seemingly bullish feeling in the market price, I may need to relook at some of the strategies and holdings to see where their current valuations are at the moment. In other words, I may sell to take off some profits in order to build a sizeable cash position where I can deploy when there are better valuations out there during correction. There are definitely a few which I think is at fair or undervaluation so I will continue to keep them.

How is your portfolio doing for February? What is your current strategy towards the market?


Valuation Thoughts on Sembcorp Industries - Part 2 (DCF vs EPV Analysis)

Following up on the recent full year results which I have blogged on my thoughts here, it'll be interesting to update the valuation methods which I have done a couple of months ago (here) to see where it stands now that we have a more recent FY14 results to input.

Previous DCF Analysis

Just to give a quick understanding of the assumptions used in the previous model, I have used the FY13 results with a forward growth rate of -1% for the first year and 5% for the next subsequent years. The discounted WACC rate used is 10% with a terminal EBITDA multiple assumption of 11x. The model came up to an intrinsic value of $3.30.


Current DCF Analysis

I have now adjusted the model based on the following assumption which I think is more reasonable:

  • 1% Growth for the next 2 years and 2% for the next 3 years.
  • Capex includes both maintenance and investment expansion and the assumption is a 10% lesser each year due to probability of marine slowing down.
  • Discount Rate (Required rate of return) of 10%.
  • EBT multiple long term average of 11x.
  • Net Debt Borrowings of $4,734 millions.

If there is one thing I would like to highlight here it would be to note the negative free cash flow the company is currently generating because of the aggressive expansion mode on the investment capex they are engaging. This is the very same reason why you would see a huge increase in the debt borrowings from previous year that almost double. They simply do not have the cashflow at the moment to run the expansion without the use of the leverage.

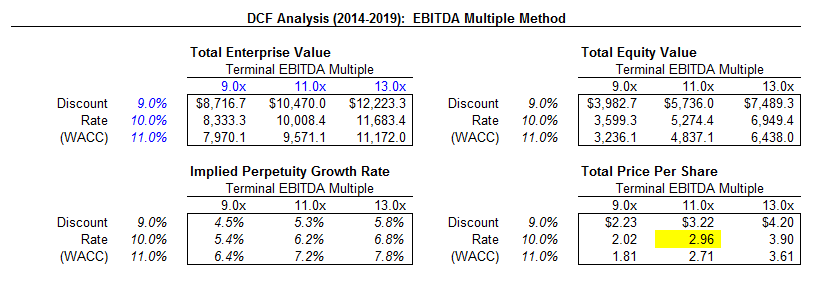
Based on the model with the above assumption used, the intrinsic value for a 11x multiple is $2.96.


FCF Analysis - 2014 to 2019


DCF Analysis - "Intrinsic Value of $2.96"

You may have noticed that in my previous post I have segregated both the maintenance and investment capex that the management has revealed. Therefore, to include both the maintenance and investment capex in the above DCF calculation model is relatively unfair because you have not accounted for potential future growth arising from the expansion. In other words, we should be seeing a completely different model should the company is in a position that generates free cash flow from only its maintenance capex. If they can get to this stage, the free cash flow yield will be so high that it can repay all their loans in less than 3 years.

Based on this model, the intrinsic value for a 11x multiple is $5.16, a much improved from the previous round.


Only Maintenance Capex is considered

DCF Analysis - "Intrinsic Value of $5.16"


EPV Analysis

You might have recalled that I have previously blogged about a different valuation model using the Earnings Power Value (EPV) analysis in comparison with the DCF analysis. If you would like to review them, you can refer to the previous post here.

This earnings valuation by Bruce Greenwald is favored because it does not consider future earnings projections unlike the DCF model and rely on current earnings to come up with an intrinsic value. Some adjustment is required as we will see right now.

The concept of EPV starts with EBT that requires us to pick out an average normalized income that has been adjusted for historical trough and peak. This is to ensure that the income is normalized to average out any historical biases. For this exercise, I have presented 5 different possibilities by taking the average normalized income for 3,5,7, 10 years and the median. At first, I wanted to use the lowest amongst the 5 but thought it would be unrealistic to consider that way. The point of this exercise is to ensure that we do not overestimate the income used but certainly we do not want to underestimate the input either.

To smooth out the unusual years but reflect recent developments, I will use an average normalized income for the latest 5 years data, i.e $1,251 millions.


SG&A Expenses

Next, the EPV analysis recognizes that part of the SG&A expenses are made to maintain and replace the existing assets, while the rest goes to execute and support future growth sales. Since we are only interested in what it costs a going concern to maintain the existing asset base, it adds back the portion of SG&A that are in relation to supporting future growth sales that should not be accounted for. Greenwald recommends at least adding back 25% of this portion as the bare minimum but since we know that a huge capex is being directed for future growth (92.6% for growth and only 7.4% for maintenance), I will be adding back 40% to the adjusted normalized income.

Maintenance Capex

As explained above, the concept of EPV analysis should be based upon the current free cash flow of a company and excludes consideration for future projections. In this regard, only the maintenance capex will be subtracted from the adjusted normalized income. Since we know the actual figure from the management figure, we will stick with it.

Depreciation

We also need to add back the excess depreciation expenses into the adjusted normalized income since this represents a deduction for future growth related. While Greenwald recommends at least adding back 25% of the excess depreciation, it varies from industries to industries and I would prefer to be slightly more conservative by adding back only 18% of the excess depreciation (which is half the amount of the actual maintenance capex incurred).

WACC

We assume the discounted required annual rate of return here to be at 10%, which has been consistent with the figure used in the DCF analysis.

Cash and Debt Adjustments

The EPV analysis assumes that all the capital used is taken an equity capital. In other words, it ignores both the interest paid on debt and interest received on cash & cash equivalent including fixed deposit. Therefore, we will need to adjust by subtracting debt from the EPV and adding back cash in excess of operating requirements.

In summary, what we have now is the data below:


Based on the above assumptions used, we now have an intrinsic value of $5.74 after adjusting for the cash and debt using the EPV model.


EPV Analysis - "Intrinsic Value of $5.74"


Conclusion


Even though these models are largely dependent on the inputs and assumptions we put in, it stretches our research to outreach many of the individual items in the income statement, balance sheet and cash flow statement for our consideration. It gives a great exercise to understand every aspect of the company better by diving down to each individual items in detail.

Based on the comparative analysis in the summary appended below, we can see that the intrinsic value for the DCF case 1 is $2.96, which is about similar to what their current book is being valued. The reason for such low valuation is because much of the growth capex has not been accounted for in the potential earnings growth which might come a bit later in the years that we do not accounted for when doing the DCF analysis (mostly we only take into account the next 5 years of earnings).

Comparing this with the DCF case 2 by taking out the investment capex, we get a much higher valuation at $5.16. The reason is because by only retaining the maintenance capex, the company is able to generate a very high free cash flow that they are able to repay all their current loans in 3 years.

It is therefore also not a surprise to see using the EPV model come up to a valuation of $5.74 because what they are essentially doing here is to account for current situation, not future projections. Using this model, the current price would provide a 35% discount to the intrinsic value.


Doing this exercise has allowed me to understand the company on a level much better than before. I remained fairly confident that the management is able to generate returns to shareholders much better in the future with the investment they put in right now. The oil risk saga, debt level and continued drained free cash flow at the moment is one aspect of risks we need to give a fair consideration but given the management past record on churning out good internal return, I think they'll be able to manage the cycle effectively.

Vested with 9 lots of SCI and am looking to increase position should the opportunity arises.


Dividend Income Updates - Harvesting the Fruits in 2015

It seems almost just a couple of blinks ago that we celebrated Christmas and get everyone setting down their resolution for the new year. Unconsciously, we are already into the second month of the year and soon we will be heading into the third month.


Friends and readers of my blog would know that I am a big proponent of cashflow as compared to net worth. I chose to focus on cashflow because it is a direct income that allows me to dictate my own lifestyle at my own territory terms. My lifestyle revolves around the way I handle my working capital appropriately. If I have more flexibility in the income during the month, I usually level up my expenses a little bit to reward my familes (and myself). The incoming cashflow would come in the form of salary and dividend income while the cash outflow comes in the form of the daily expenditures. One fine day, I hope these dividend income would be sufficient to hit the crossover point, the point synonymous with financial independence and the freedom to free myself from the mundane corporate life I have been staying for the past 7 years.

When I did these regular updates of the dividend income, my main intention is to track the amount of these income received for my own future reference. The other intention is to provide some kind of inspiration for young starters who might not believe that this kind of passive income is completely possible in their lifetime. It is always much harder planting the seed when I just started out and much relieved harvesting the fruits of the labor when I look back at this point. Nevertheless, there's a long way to go for me so no slacking on that.

As the reporting season began to wine down, I have tabulated across the amount of dividend income I will be receiving for the month of February. Since I have pared down on selling some of the Reits in recent months, notably the likes of Ascott and Ascendas Hospitality Trust, the amount of dividend income received for this month will nowhere be as significant as the previous year. Still, this shouldn't be an excuse not to track down the amount of dividend income received.

Without further ado, I will receive a dividend income of $1,096 for the month of February. The breakdown is as follows:


CountersDividends (S$)
FraserCenterpoint Trust825.00
FraserCommercial Trust271.00
Total1,096.00


One of my goals for 2015 is to receive a dividend income of $18,000 for the year. This month's result is a good start at 6.1%, though it stretches somewhat an extremely long way to go to reach the target. With still another 10 months to go, I'll work to see how that plays along as we approaches closer to the end of the year.

How was this month dividend income for you? Did you get a good start to the year?


Sembcorp Industries FY14 Results and Thoughts

Sembcorp Industries have recently announced their full year results for the financial year ended 2014 and you can view the results on their website which I will not repeat and go through in detail here. I just wanted to focus on a few details which I am looking out for.


1.) Utilities by Segmental

I've personally known many investors who are invested in SCI due to their resilient business in the utilities. We think that utilities is a segment that is defensive in nature and will be recurring and growing over time. Like any business, there is always the risks of competitor threatening and this is no exception. Never had we thought that the risk of a competitor would threaten the utilities business so fast which leads to the decline in the profit margin drastically. As an investor for the company, I think the key is to particularly look out for decline in the local segment and how much it will decline further in the future.

If we take a look at the utilities breakdown in detail, the major shortfall is coming in from a decline in the energy power segmental portion of the business. Total year on year we are looking at a drop of about 25% in the energy segment alone. What literally hide this segmental portion was the 4th quarter spectacular results from the Water and On-site Solid Waste segment to bring the total core up by 7%. Nevertheless, you still can't deny that the energy is key to the long term growth of the utilities business as we will see later that their capex is mainly focused on this part of the business.


You might recall that a couple of months ago I posted the Uniform Singapore Energy Price Index (USEP) for the past 3 years. The trend is clearly on the way down and we will see what the threshold is for 2015 currently. Fast forward to 19th Feb 2015, the USEP is currently at the average of about $96/MWH. It's clearly declining due to competitive bidding from competitors and the lower oil prices doesn't help. It appears that this is causing some serious profit margins decline in the energy segment.


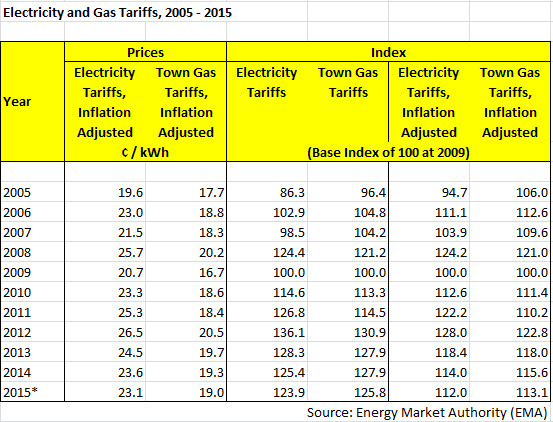
The other thing to take note for this energy segment is the lower electricity tariffs from the weaker High Sulphur Fuel Oil (HSFO) which you can see was adjusted downwards due to the low oil environment we are at right now. I don't know if you as consumers notice about this but I have personally been seeing lower kwh charges and they have been refunding me on some of the deposits which indicate lower electricity charges these days. 


Now, if we look at the geographical segmentation for the utilities business, we see that the SG portion is declining but the rest have contributed positive growth on the bottomline. The main reason as explained above is of course other than the low global oil prices there is also stiff competition from competitors such as Senoko, Power Seraya and Tuas Power, which has a bigger capacity than SCI itself. The China (due to stronger contribution from the wind power asset) and Rest of Asia (competitive electricity tariffs) are still performing growth though do note that the UK profits include the one off divestment gain from the sale of one of its business.


2.) Maintenance vs Investment Capex

Based on the presentation from the management, they have revealed that out of $1,586M of investment and capex, $1,469M belongs to investment capex while the rest goes to maintenance capex. This translates into a percentage of about 92.6% for investment capex and only 7.4% for maintenance capex. In my previous valuation post which you can view here, I tried to estimate the capex between the two and came up to a rough percentage of 64% for investment capex and 36% for maintenance capex. I am actually pretty surprised that their maintenance capex came up to be very low. In other words, they are expanding pretty aggressively for the past few years now. The company did cite that the marine business might see a slowdown in the expansion capex so we'll see a lower figure in the upcoming few years.

If we take a look at their pipeline over the next few years, we will be seeing more positive contributions from the energy portion from India, which could cushion the decline in SG. Already, we should see some contributions kicking in from India with the commencement of their Unit 1 TCPIL by 2015 and another Unit 2 will follow in 2016. The Water segment is growing well so we'll see another positive contributions there. Having said that, I just feel the decline in SG might be a little too big to cover from the India contributions at this point so we might still see some pressures unless the other segments can step up to cover this yet again.


3.) Balance Sheet

We shouldn't forget about how the company is structured in terms of its balance sheet now.

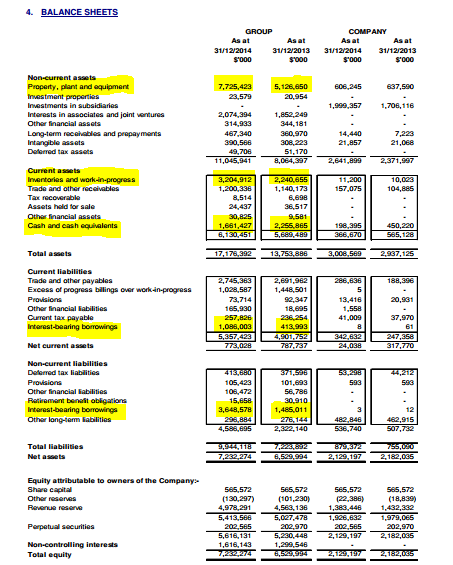
The highlighted portion is what I think we should be looking out for the major changes.

A quick overall look and we can see that the company book value is on its way up now with the obvious positive profit contributions retained (less dividend payouts of 36%) for aggressive expansion purpose.

The company's borrowings have visibly increased now due to their consolidation of TPCIL and part stake in the marine business from SMM. With expansion slowing down from the marine side, I expect the company to repay quite a bit of the borrowings in FY2015.

The Inventories and Work-in-Progress portion increased due to payment terms of the rig building projects from the marine side. This could be a worry if there are delay or payment default should the global oil decline further which means that cashflow could be tied up over here.

Overall, I just feel that the company's overall balance sheet has come under pressure due to their aggressive expansion mode from both from the utilities and marine and they are unable to recover their cashflow as soon as possible due to the nature of the payment terms of the rig.


Final Thoughts

I think as long as the oil price continues to consolidate or decline from current stage, we won't be seeing a much improved year on year growth on the EPS for the company. 

The utilities segment of the business is still in the midst on the expansion mode and any positive contributions from other areas will only mitigate the losses in the SG geographical segment. The marine business has an order book filled until 2019 so unless there are any drastic cancellation we will probably see its profits being maintained similar to FY14. The rest of the other business is still too small to make a positive contributions on the overall.

I have no doubt that the company will still be able to achieve about 44-46 cents EPS for FY15. Paying out a rough 16 cents dividends (a drop from last year of 17 cents which do not worry me), they will be able to retain the rest of the 64% for investment growth purpose, though based on calculations they will need a lot more money on this.

Until we see a recovery in the oil price, we'll probably see continued pressures for its stock price to hang around the current range.

Vested with 9 lots and will continue to be vested and observe further.

What about you? Are you still holding on to this?


Design Studio - A Stock with 13.8% Dividend Yield Play

Design Studio, one of Singapore’s leading premier furniture manufacturer with core businesses in furniture and interior fittings, announced its full year results recently.


They may not have an extremely popular household brand name that you often hear on the street, but you may want to take notice of this company given its strong earnings and dividend yield and a strong balance sheet with no debt profile.

What has caught the eye for many investors is the management generosity with their dividend policy over the past few years. This financial year was no exception. For the financial year ended 2014, they have once again announced a dividend of 6.5 cents (0.02 Final + 0.04 Special + 0.005 Interim) which translates into a dividend yield of 13.8% with their previous closing price at 47 cents before the announcement was made. The stock price rocketed to a high of 55 cents which still translates into a 11.8% yield for investors who are a sucker for dividend yield before retreating to around 53 cents. The question now is whether we will see this as a recurring dividend yield play rotation for a company which is relatively doing well on its core business.


Dividend Sustainability

If we are looking at this from a trader point of view, this can be a quick hit and run play as I will explain later.

However, if we are looking at this from a business and investor point of view, we want to ensure that the dividend payout to shareholders is sustainable for the long run so that both company and shareholders can reap the benefit from the business they are operating.

If we take a look at the table appended below, I have summarized the important metrics you need to look at for the past 3 year results.

This is a company that has generated good earnings yield consistently because of the business moats they have built up over the years and the best part about companies operating in such manner is the very low capital expenditure they are required to fork out to fund the business. As a result, free cash flow yield remains very high and the company can pay out a good high dividends to shareholders while maintaining the rest of the earnings to strengthen their balance sheet at the same time. A Winner's characteristic.


However, do take note that in 2013 the payout is much higher than their earnings so I am still a little skeptical about how conservative the management is trying to play out with the shareholders here. I would rather they do it the Vicom or Kingsmen way, slow and conservative but more sustainable. 

Balance sheet remains solid with cash equivalent increasing to $48 million from $44 million last year and the company has zero debt on its book. 


Comparison Play with a More Conservative Management 

I would like to take a moment here to compare Design Studio against companies whose management is rather more conservative in distributing dividend payouts. 

If we take a look at the table appended below, it appears that Design Studio has the best earnings yield amongst the three. This means that the price to earnings ratio for the company is the lowest as compared to the other two, which is at around 12x and 18x respectively.


The interesting observation about their identical requirement for the three companies is they require very low capital expenditure maintenance due to the nature of their service business. In other words, they are providing a service to customers which means that salary is probably their largest overheads. Contrast this to the machineries or telco industries and you get the idea. The free cash flow yield for these companies is therefore very similar to the earnings yield they have. 

Design Studio pays out more of its earnings as dividends as shown through the payout ratio metrics. This enable their stocks to rise much higher upon the announcement than the other two which is more conservative. This may not be a bad idea overall if the management is unable to use the cash available to generate a high IRR. The other two are more conservative in the payouts which means that more earnings are retained back into the business or as cash or as working capital requirement. 

The other interesting to note about this is the amount of cash as a percentage of their total assets. Obviously, if the company distributes more of the earnings as dividends, they will have to retain very little in their books. For investors, they would obviously love the company to distribute a higher dividend back to them as seen from the market share price movement. Depending on how you see this, there is a downside to this of course. 


Playing this the Trader’s Way 

I do not generally recommend that you do it this way, but I guess for those who are trading a quick in and out playing this stock could consider this method.


Design Studio Stock Chart

We already know that the management is rather generous in distributing dividends back to shareholders. The idea is to keep a close lookout on the Q1 to Q3 YTD earnings and see if their earnings for the full year would keep up and warrant the management to dish out the special dividends again. The hint is probably in the earnings yield and free cash flow yield and if they remain consistent then expect the management to do the same again. You can exit once the company announces the full year and dividend announcement results and profit from there, just like what had happened again for this year.


Conclusion

This will be on my watchlist.

I have not done an extensive research on the qualitative factors on the company so it will be a while before I would invest in the company. The balance sheet is rather strong though the management seems eager to distributes a whole lot of earnings back to shareholders, which become a subject for higher volatility for the stock price. This can also be bad especially since shareholders are accustomed to the high dividend yield the company pays out over the past few years and in years where earnings are poor, dividends would be severely cut as well.

What about you? Anyone have other thoughts on this company?


Joie Restaurant (by Dozo) - A Real Value for Money

As a financial blogger and a secret food explorer myself, there is one common attribute that I am always on the lookout. That attribute is Value. I have tasted plenty of great food with great ambience in my life, but they usually come at a high price to it. It is rare that I find a truly good value deal for money for a restaurant and when I do find it, I usually try to share my experience so that others can experience it as well.

If there is one thing good about killing two birds in one stone, it is to find a wife whose birthday is around the corner of Valentine's week. Just kidding. I celebrated my wife birthday today at a restaurant called Joie by Dozo. It is located at the Orchard Central on the roof garden where you can reserve a private room with view facing the garden. Amazing view with a great ambience for a casual fine dining.


Amazing Garden View

When we reached there, we were greeted by a very welcoming host who led us into the private room. The temperature inside the room is a little cold for the two of us, but we were more excited about the environment and the menu than anything else. The menu for lunch comes in 6 course meal at a price of $38.80++. As there are a couple of choices that we have to choose in between the appetizer, soup and main dishes, we were thoroughly explained by the waiter who had provided us extremely good service all around. In the end, we went with most of the recommendation he suggested.

As we were waiting for our first dish to come, we were given a welcoming thirst quencher which makes up of some pineapple cocktail to start with. Taste really refreshing.


Pineapple Cocktail


Divine (Dish 1)

The first dish was the appetizer which is standard across the selection.

They are made up of some Vanilla pancake with some carrots and Aloe Vera at the center. The last on the left is cooked cranberry twiddled with some green teas powder.


Chef's Selection of Assorted Platter

Prelude (Dish 2)

The second dish looks like still an appetizer to me. I don't really know how many appetizer prelude does a fine dining has but it looks really good to me.

Mrs B was having the Transparency of Manchego Cheese where it is basically a cheese at the cover with some rocket salad, mushroom, red and green pepper, walnut and black olive at the top. I tried a couple bite of those and it does taste pretty good considering that I am not a big cheese fan to start with.

I was having the Gratinated Champignon with Mozzarella where it has button mushroom gratin served with tennessee heirloom potato puree and an endive focaccia to it. I really like this dish a lot and no regret choosing this set for this round.


Transparency of Manchego Cheese

Gratinated Champignon with Mozzarella

Elixir (Dish 3)

Next up is the soup on the agenda.

As soon as I tasted the lady choice, I knew I was going to lose this round by a huge knockout. Mushroom, Cepes and Truffle soup are my favorites and they do not disappoint for this one. I was going to choose this for my selection but I wanted to try out different soup and I ended up with the Green pea espuma which basically is made up of green pea in powder foam and a couple of baby sprouts. It tasted quite weird at the beginning but slowly grow as you finished up on the last drop.

Infusion of Cepes and Truffle

Espuma of Green Pea Cappuccino


Crescendo (Dish 4)

By this stage, we were pretty full already so we took some rest and photo before going to the main dishes.

Mrs B chose the Trio of Spheres for her main dish which made up of fresh wild mushroom with truffle oil and onion puff pastry and butternut pumpkin risotto ball with curry mayonnaise. Again, I took a few bite of hers and I like it very much with all the fried stuff in my mouth.

For myself, I chose the Truffle Risotto and Morel for my main dish and after glancing at it, I realized that it was very similar to the kind of food that Little B Jr is eating everyday. The taste is rather good with the mascarpone cream and parmesan crisp mixed with it, though my mind was thinking about my boy as I was eating it. We had a little laugh missing our little one on this occasion.


Trio of Spheres


Truffle Risotto and Morel

Sweet Endings (Dish 5)

After the main dish, it was the everyone's favorite section of the dessert.

We saw the waiter pushing out the main dessert cart and advises us on the selection of the desserts available. We were told to choose in between a few selection of cakes, chocolates and macarons. These were really good!!!

Push Cart


Potion (Dish 6)

Last but not least, we have the refreshing potion drinks towards the end of the meal.

Somehow, when I think of potion, I am reminded of those RPG games I used to play in the past where it can store some energy.

Ice Mallow Apple Melody
Ice Fruity Refresher

Birthday Cake (Courtesy of the restaurant)

Knowing that it was my wife birthday, the restaurant gave a small cake on their complimentary so we can take a photo together and capture this moment in memory.

On top of that, the restaurant also gave a complimentary tea glass that we could bring home.

Photoshoot together :)

...And a kiss from the Mr. to the Mrs.

Complimentary Gift

Conclusion

Overall, it was a really great dining experience for a great food with a great service at a great ambience with an excellent company. At $38.80++, I think this is one of the few restaurants which is very value for money and I think the restaurant and staff deserves more credits for their effort to make each customer happy.

Food: 9/10
Ambience: 10/10
Service: 10/10
Company: 11/10
Overall: 9.5/10

As I was writing this, hmm maybe I could do a food blog once I am closer to financial freedom. Food for thoughts.....Anyway, give it a try.

From a food explorer who is a financial blogger at the same time :)

 
Powered By Blogger